728x90
안녕하세요. 쇼미요미입니다.
나도코딩님을 통해 학습한 데이터 시각화 내용입니다.
오늘은 원 그래프에 대해서 알아보도록 하겠습니다.
1. 그래프 그리기
- autopct : 퍼센트로 변경하여 노출
- startangle : 시작위치 변경하여 원 그리기
- counterclock : False로 설정 시 시계방향으로 원 그리기
values = [30, 25, 20, 13, 10, 2]
labels = ['Python', 'Java', 'Javascript', 'C#','C/C++','ETC']

plt.pie(values, labels=labels, autopct='%.1f%%', startangle=90, counterclock=False)   #원그래프 그리기
plt.show()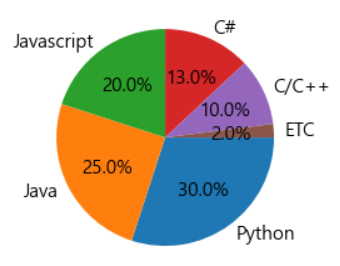
2. 그래프 간격 주기 : explode
values = [30, 25, 20, 13, 10, 2]
labels = ['Python', 'Java', 'Javascript', 'C#','C/C++','ETC']
explode= [0.05] * 6

plt.pie(values, labels=labels, autopct='%.1f%%', startangle=0, counterclock=False, explode=explode)
plt.show()
3. 그래프 컬러 변경
values = [30, 25, 20, 13, 10, 2]
labels = ['Python', 'Java', 'Javascript', 'C#','C/C++','ETC']
colors = ['#ffadad', '#ffd6a5', '#fdffb6', '#caffbf', '#9bf6ff', '#a0c4ff']

plt.pie(values, labels=labels, colors=colors, autopct='%.1f%%', startangle=90, counterclock=False)
plt.show()
4. 원 안이 비어있는 그래프? 그리기
wedgeprops = {'width':0.5, 'edgecolor':'w', 'linewidth':2}
#그래프 width값 조정, 경계선 컬러 흰색, 선 굵기를 2로 넣기 (=explode)

plt.pie(values, labels=labels, colors=colors, autopct='%.1f%%', startangle=90, counterclock=False, wedgeprops=wedgeprops)
plt.show()

728x90
'Python > Matplotlib' 카테고리의 다른 글
| [Matplotlib] 산점도 그래프 (0) | 2022.05.04 |
|---|---|
| [Matplotlib] 누적 막대 그래프 (0) | 2022.05.04 |
| [Matplotlib] 막대 그래프 (0) | 2022.05.04 |
| [Matplotlib] DataFrame 활용하여 그래프 그리기 (0) | 2022.05.04 |
| [Matplotlib] 파일 저장 (0) | 2022.05.04 |


댓글